Lab 5: Data Processing II
Or, 'Grappling with a new and formidable foe: ArcGIS Pro.'

October 5, 2022
Step 1: Mapping New Mexico counties in ArcGIS Pro
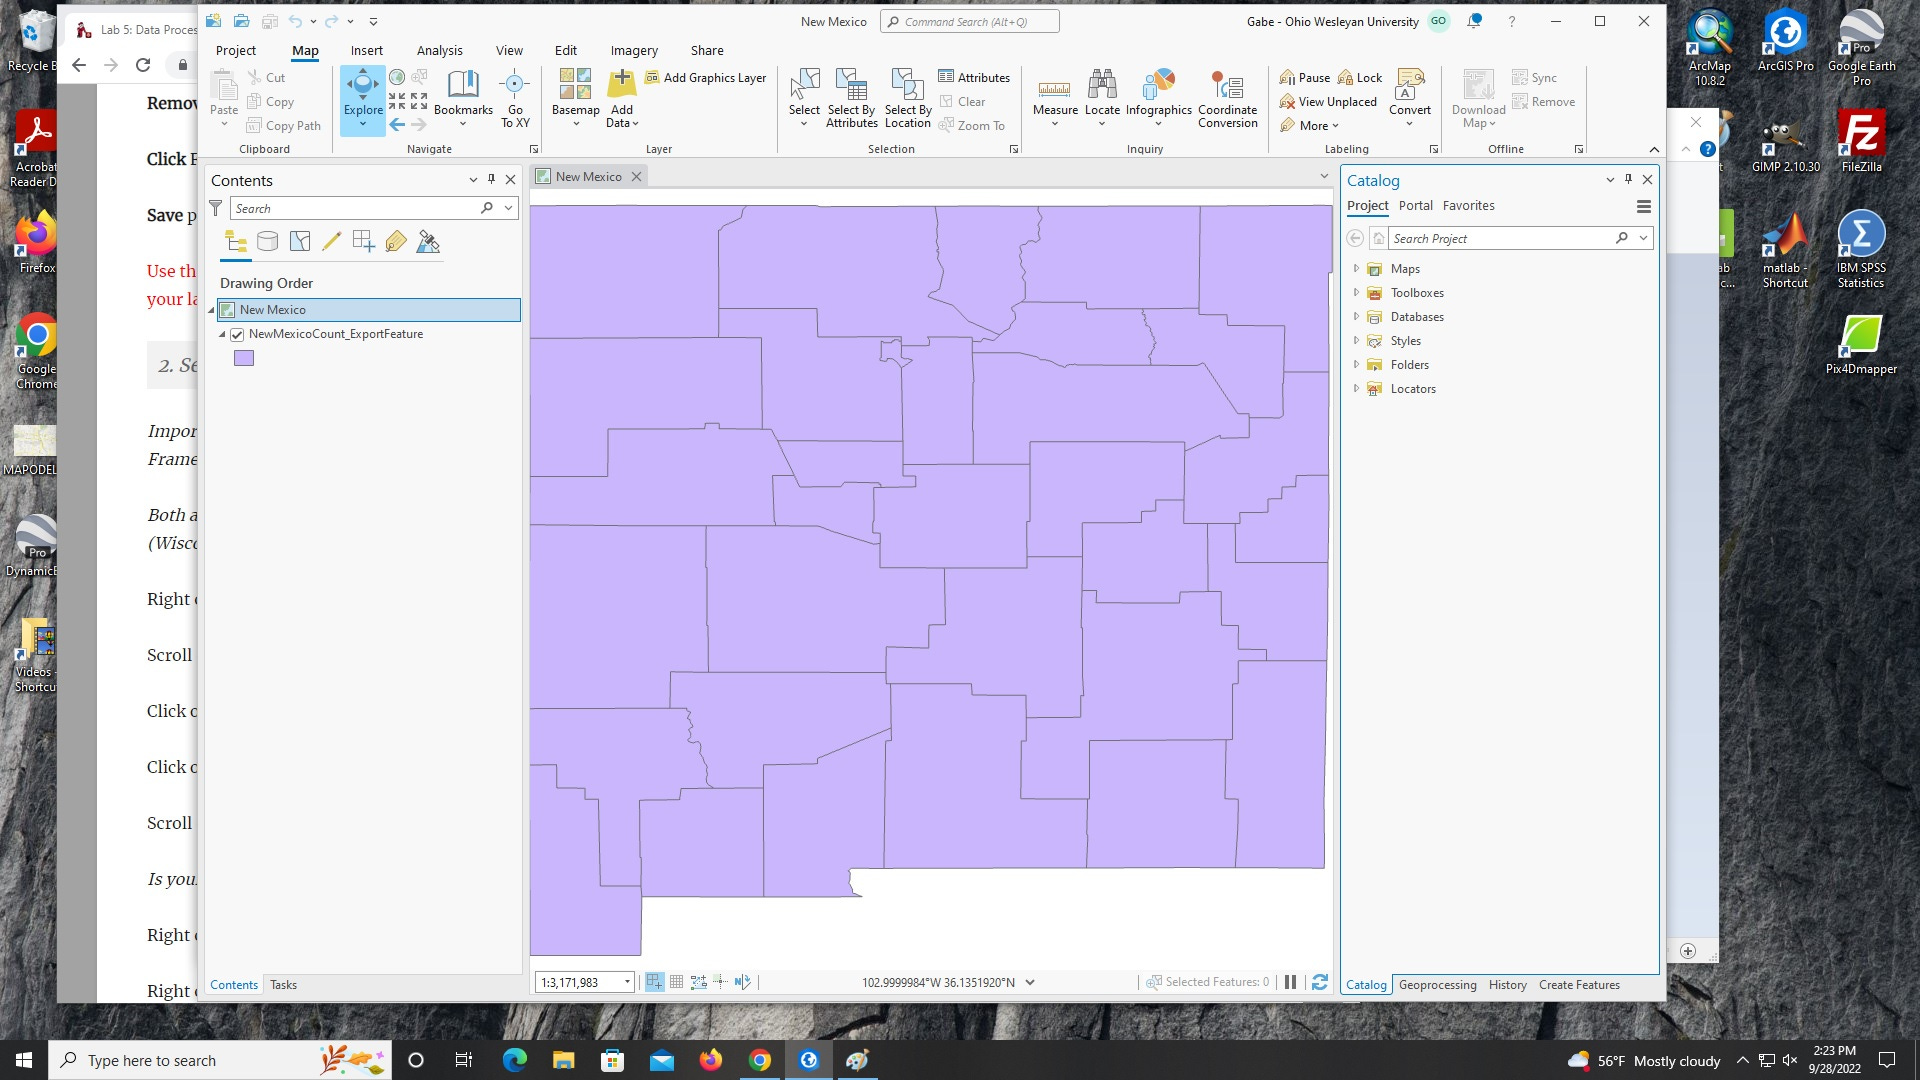
Issues: New Mexico shaped a little wonky right now. Never fear—we will fix that soon!
Step 2: Adding an appropriate map projection
Why the Albers Equal Area conic projection?
Maps can preserve some of the features of the globe (sizes, shapes, distances, and directions), but not all four at once (Making Maps, Krygier & Wood).
The four features of globes can be easily remembered with the acronym Some Snakes Drive Dirtbikes!
The Albers Equal Area projection accurately shows the relative size of geographic areas and results in minimal shape distortion when a map is zoomed in on small portion of the world (country or state). It is not considered useful for world scale maps (Making Maps, Krygier & Wood).
Issues: It took a little digging to find the central meridian of New Mexico (-106.894; source) and put it in the right format for ArcGIS Pro.
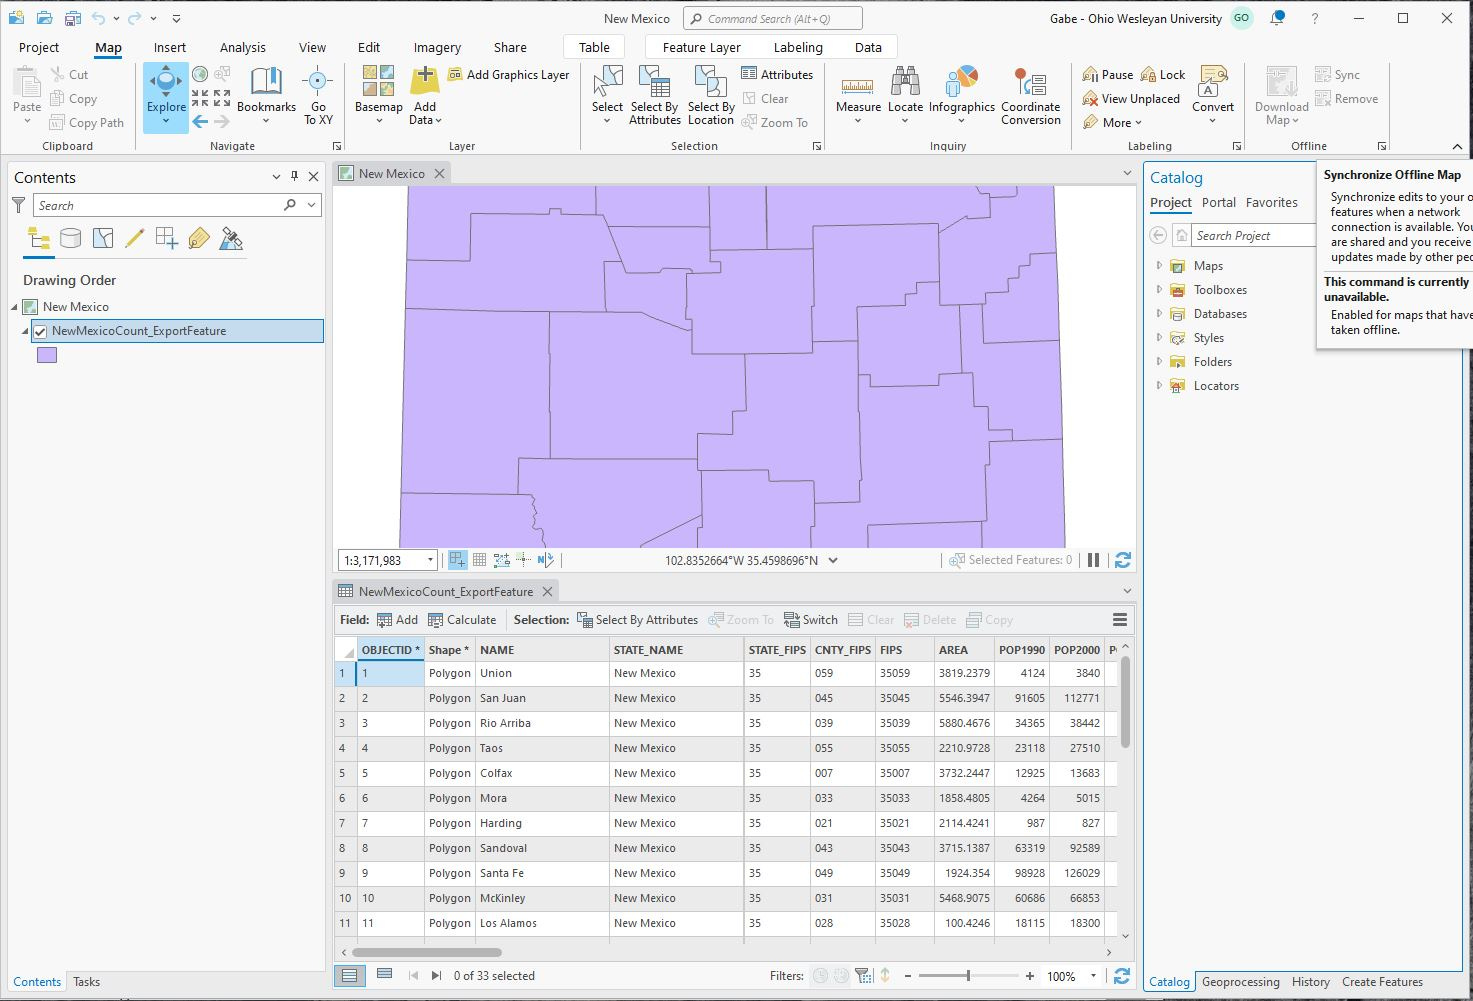
Step 3: Importing Excel data
Issues: It took me a moment to realize that the ‘Add Data’ button could be found by right-clicking on ‘New Mexico’ under ‘Contents.’ I was trying to find an ‘Add Data’ function under ‘Geoprocessing.’
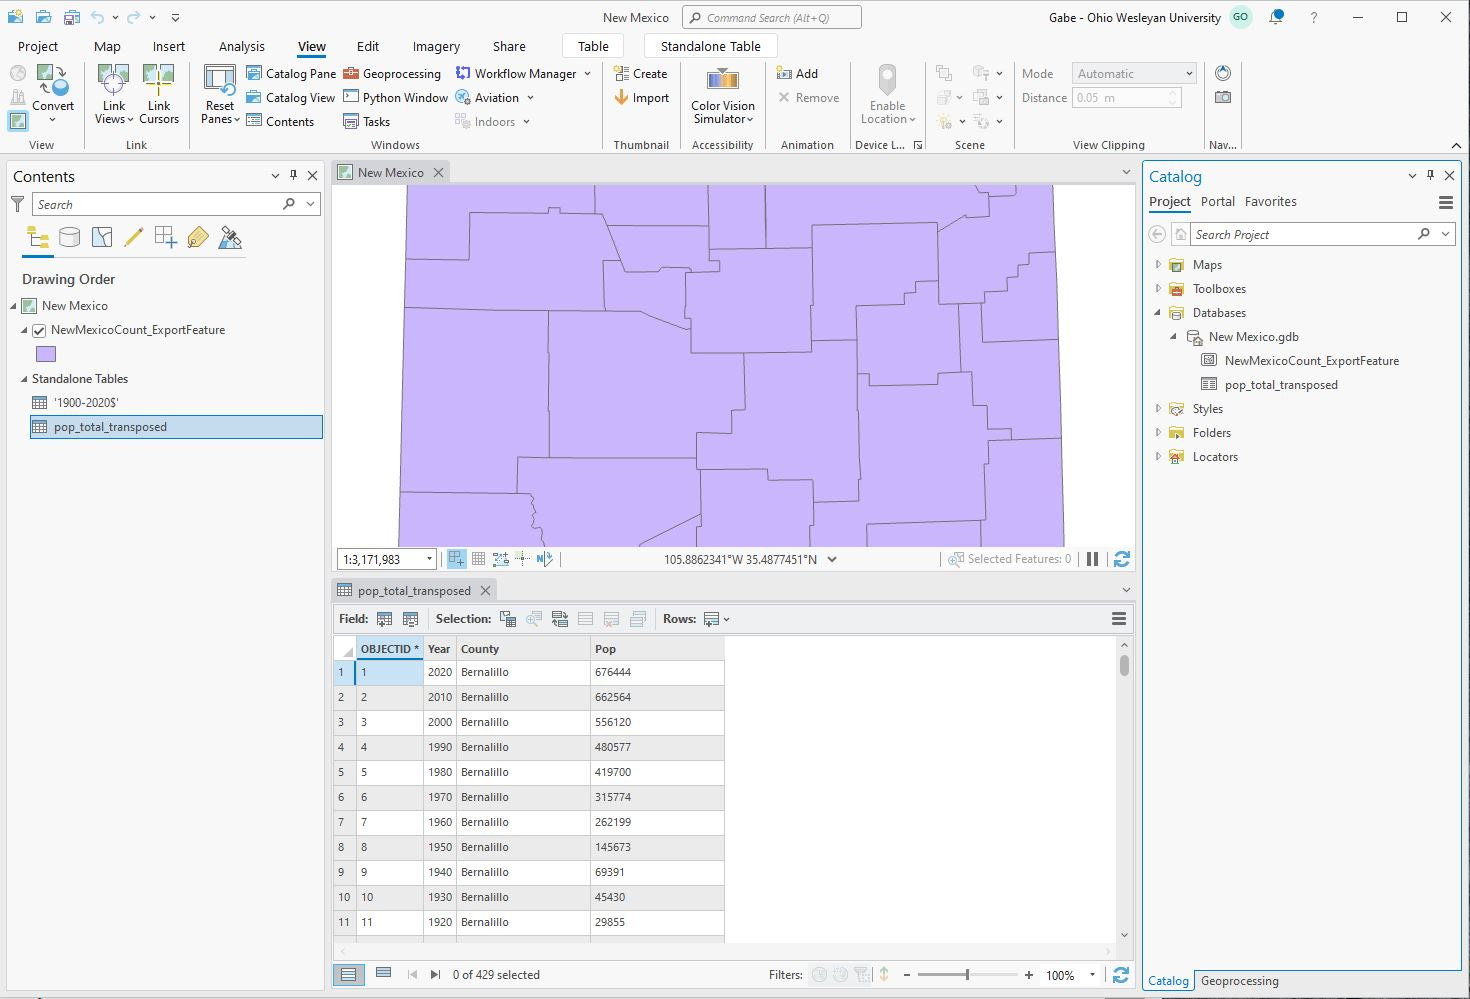
Steps 4 & 5: Changing numbers stored as text to numerical values and time values to date format
Issues: None! This step was very straightforward.
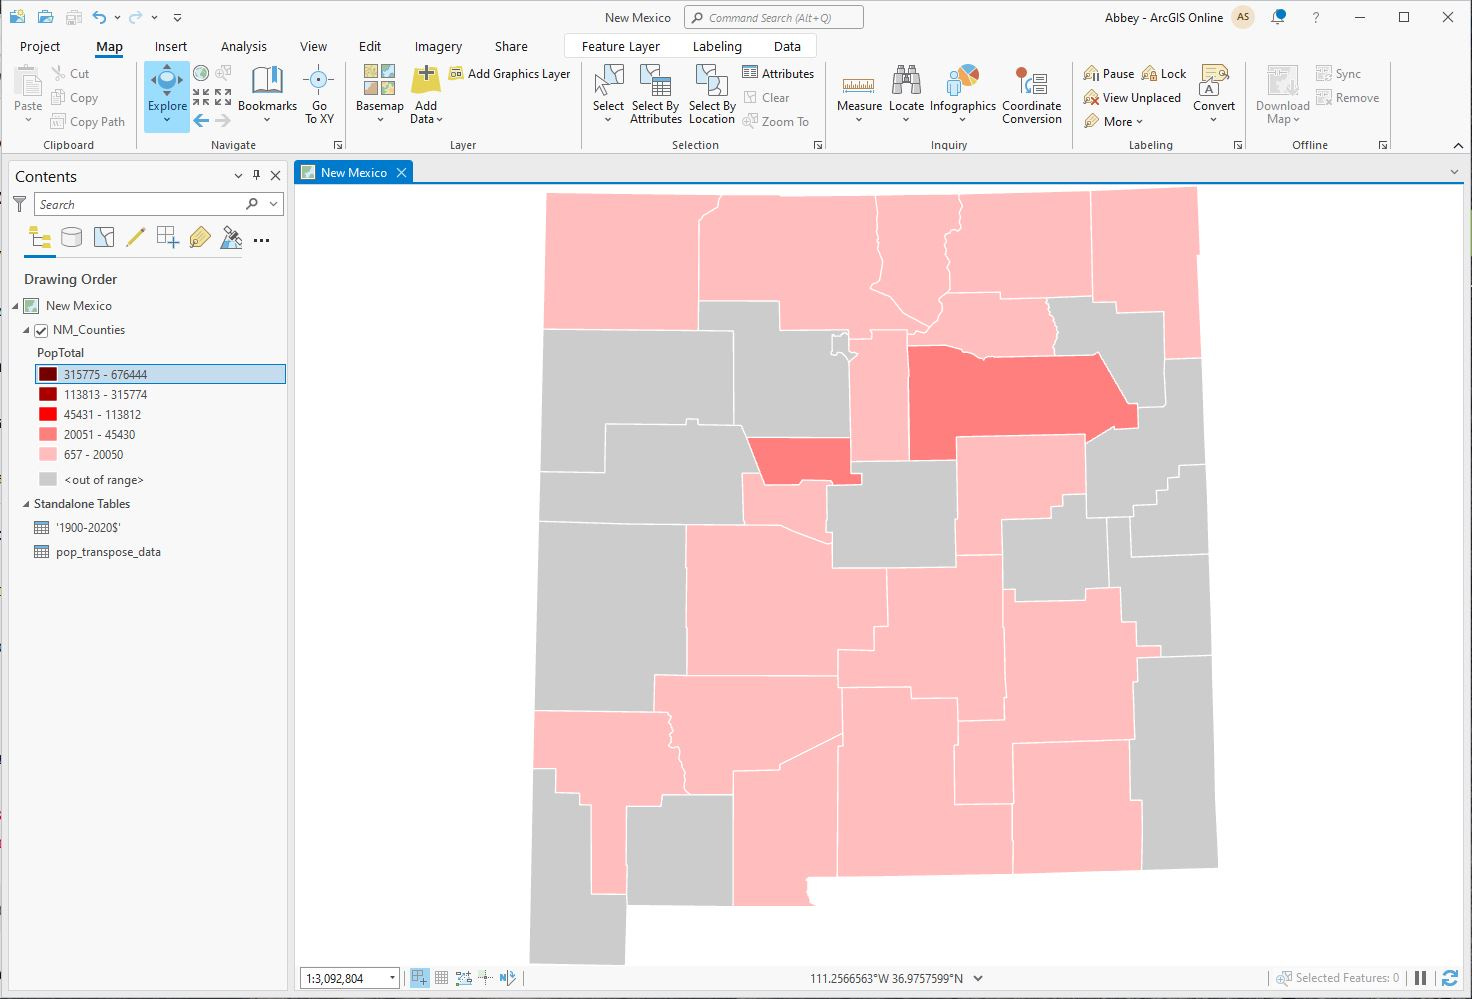
Step 6: Joining a table to a layer in ArcGIS Pro
Issues: Initially, this step went off without a hitch. Unfortunately, I forgot to take a screenshot of my work, so I opened my project again and attempted to remedy that mistake. Much to my dismay, TWO of my counties were MISSING when I reopened the map. What the heck????
I repeated ALL of this steps leading up to this point, and so far, everything is going fine…
Let’s see what happens next!
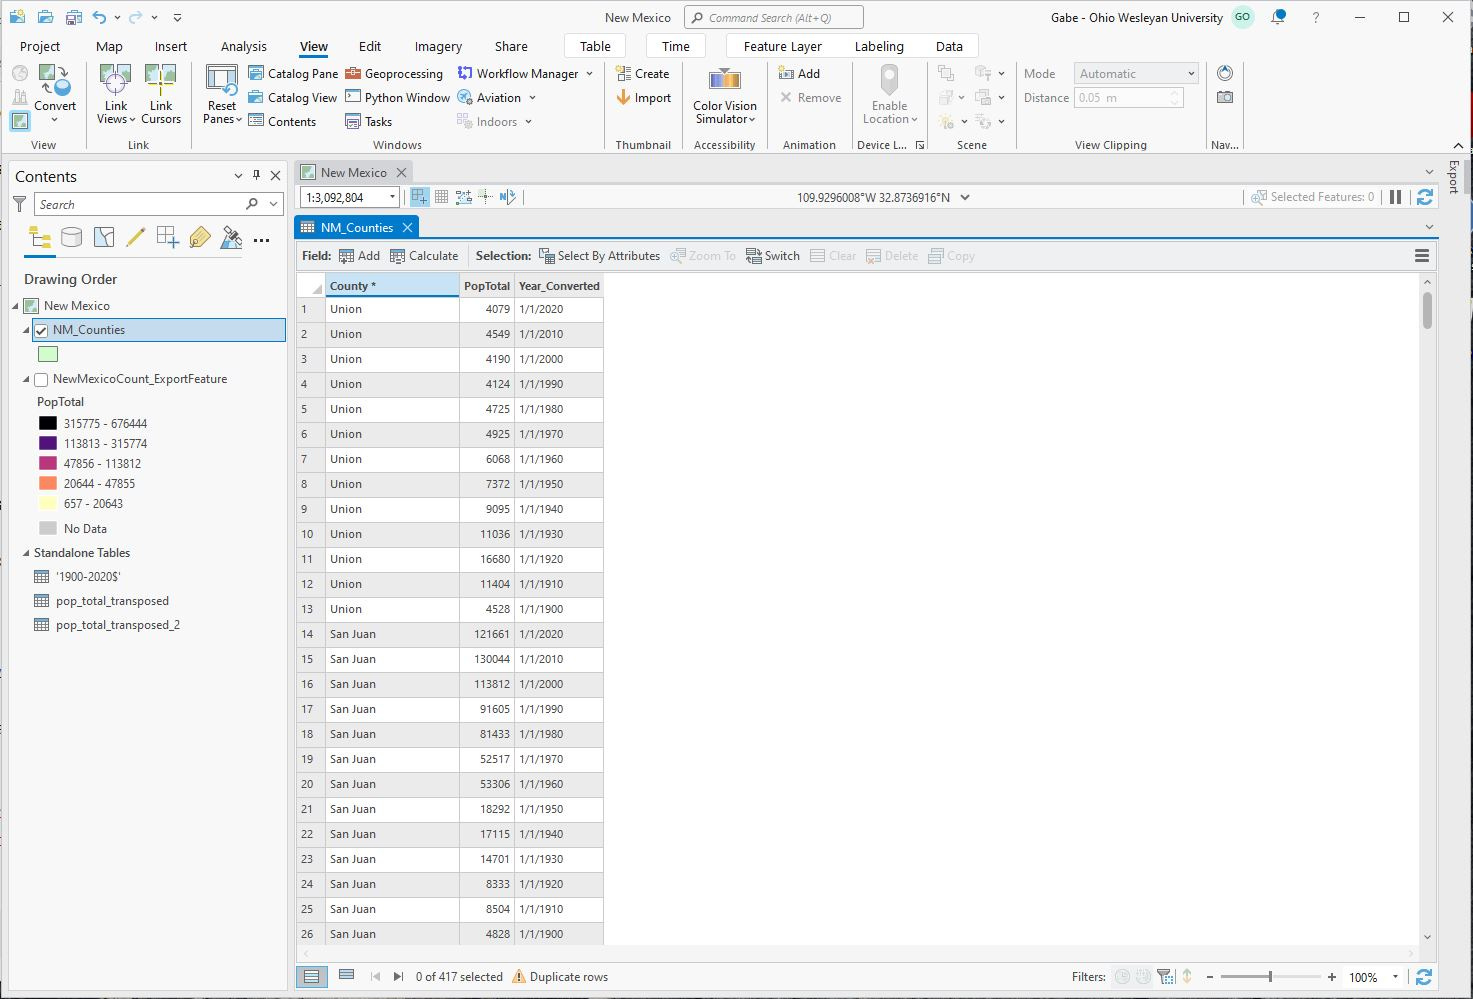
Step 7: Editing map symbolization
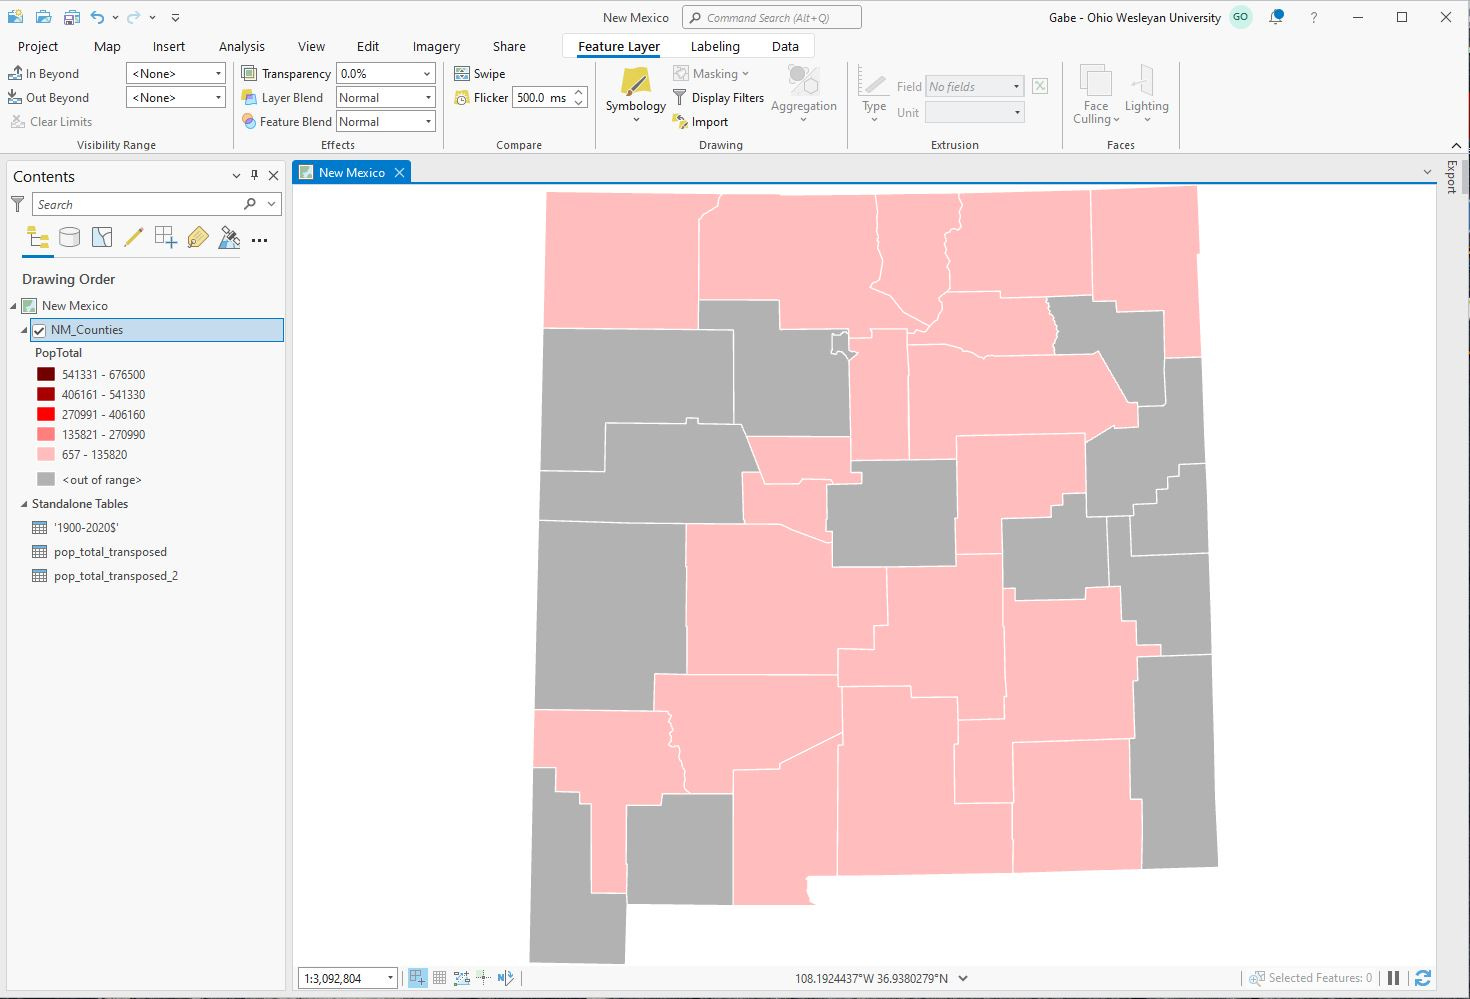
Issues: It was a little difficult trying to find a color scheme with strongly-contrasting colors.
So far, so good…
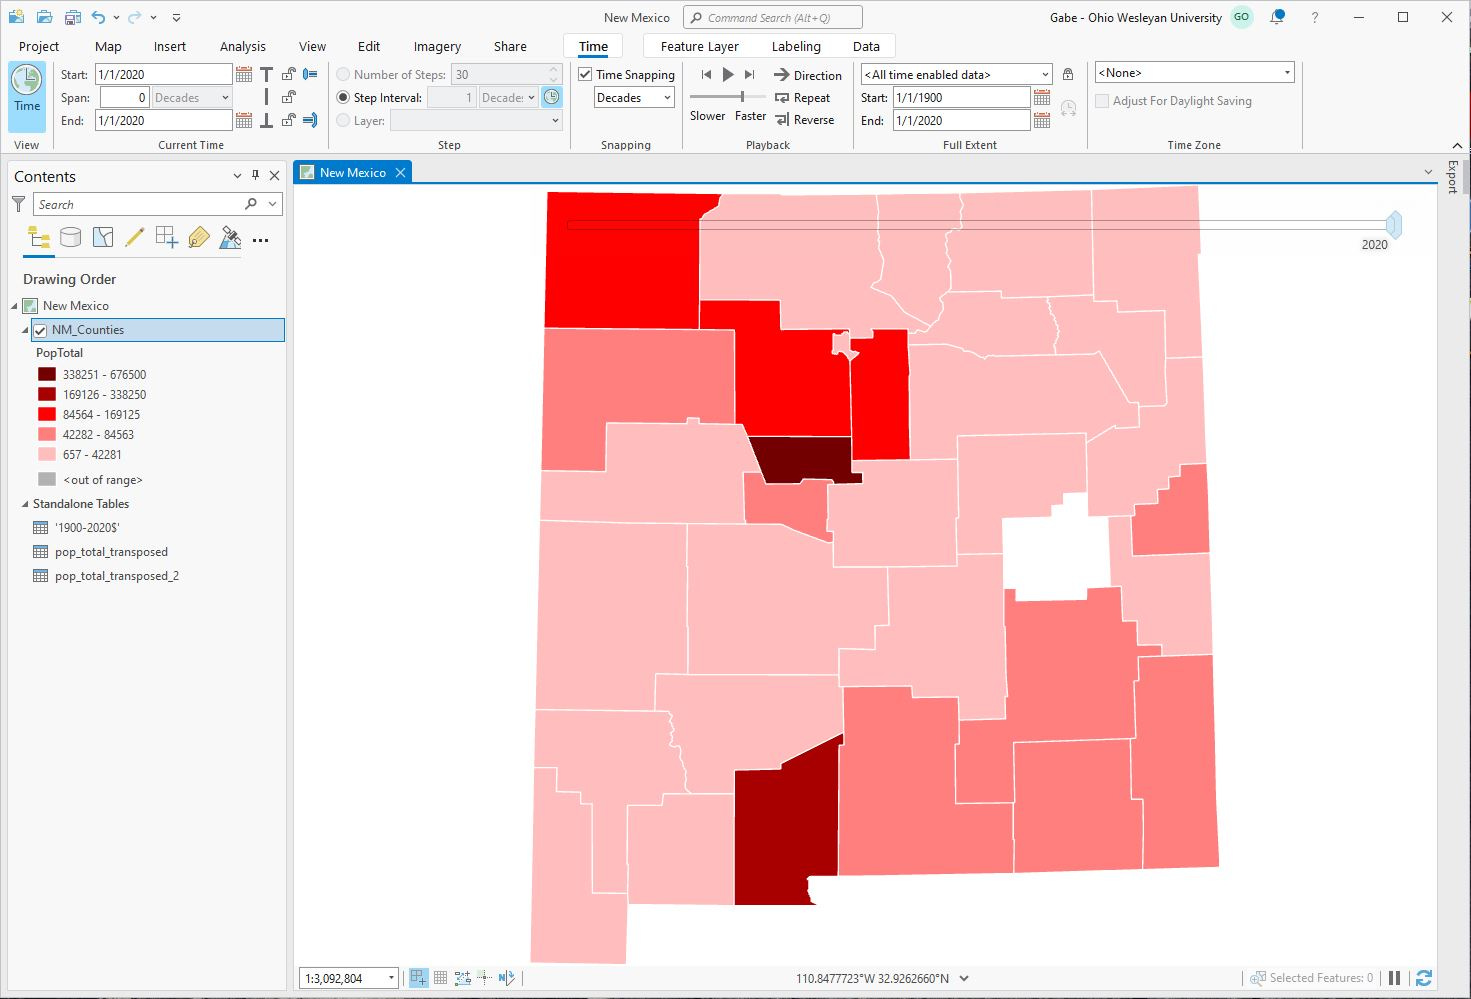
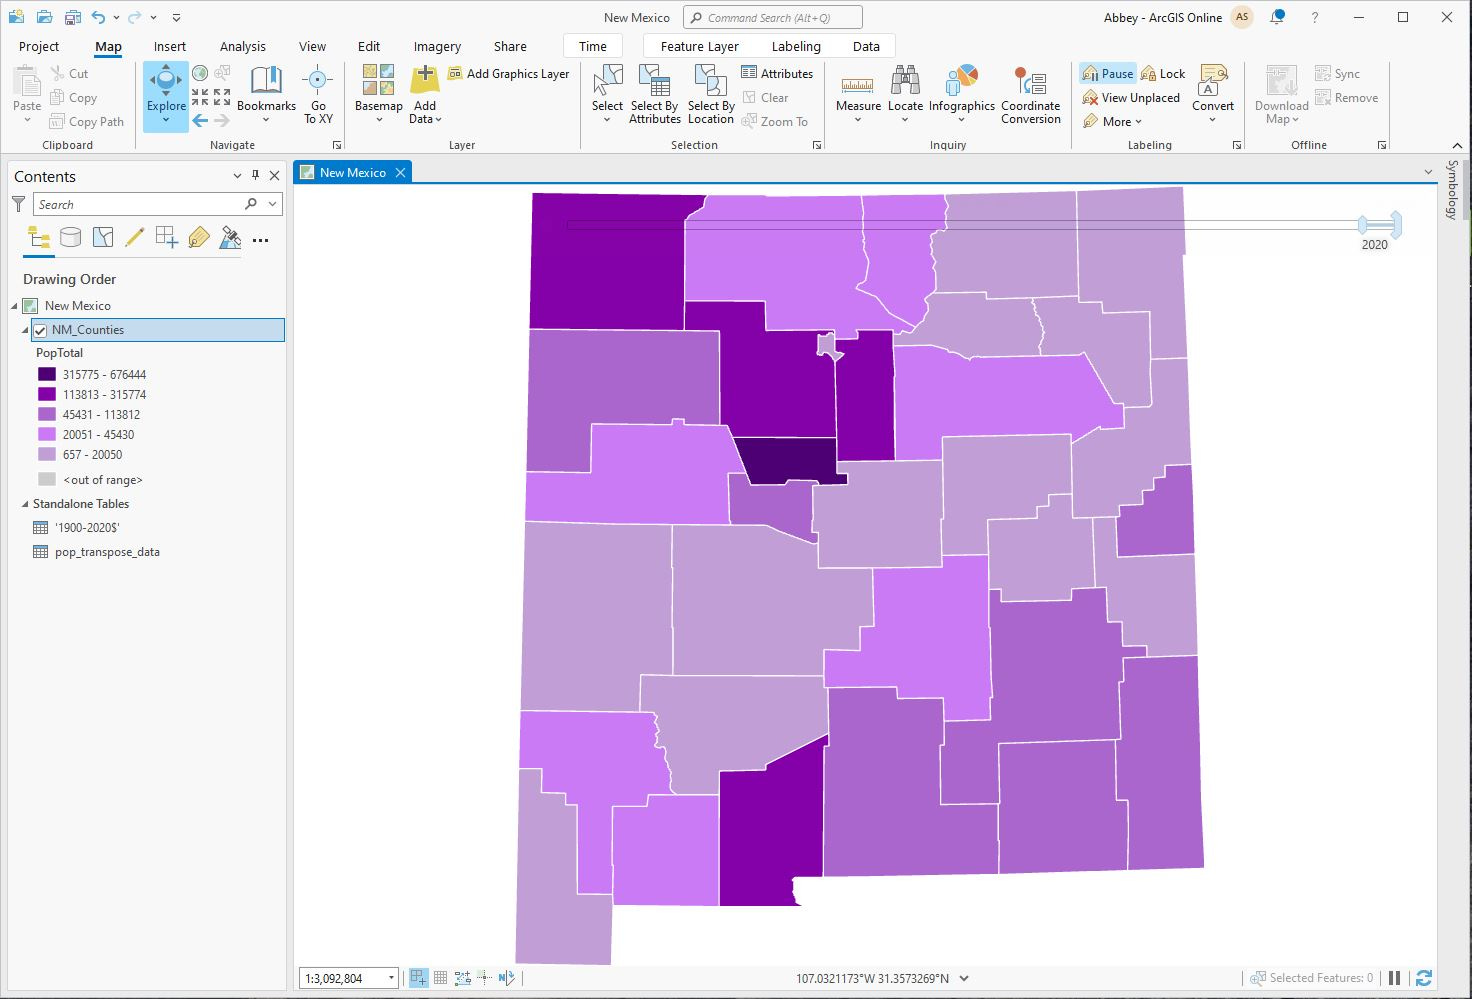
Step 8: Enabling time and animating the map
Gadzooks! DeBaca County is missing…again!!!
What a royal pain. Let’s see if we can pinpoint the root of the issue.
I did Steps 1-6 again, and DeBaca County was there the entire time. At Step 7, I noticed that DeBaca County was still listed in the NM_Counties layer and in the pop_transpose_data table before the two were joined. However, after joining the data, all of DeBaca’s information was changed to <NULL>.
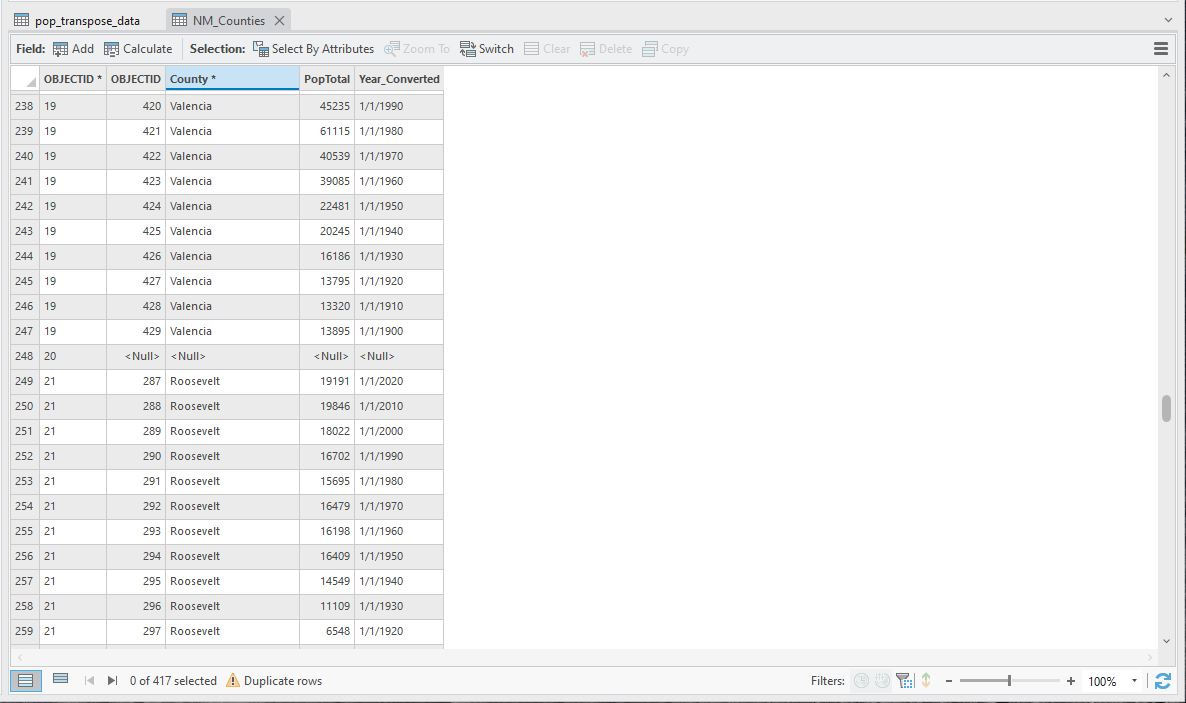
What a debacle!!! (DeBaca?)
After a quick huddle with jbk, we decided to unjoin the data and take a look at each table individually. Here, the problem became clear. The Esri county data listed the county as “De Baca” (WITH a space), and the U.S. census data listed it as “DeBaca” (WITHOUT a space). Therefore, when I tried to join the data by county name, the NM_Counties layer did not recognize the data from the pop_transpose_data table. After adding a space between “De” and “Baca” in the pop_transpose_data table, the issue was resolved—no more missing county!
Back to our regularly-scheduled program…
Issues: Other than the fact that my map is currently scab-colored, I have no complaints!
Much better.
At last! I had no issues adding the Time Snapping bar, and the animation worked beautifully. Another successful GIS lab in the books!